His response: "What Bubble?". I now see that my work here is not yet done.
I recently spent some coin, sweat, and tears learning all about finance, including the workings of capital markets, and have formed some persistent opinions about asset values. Basically, this is an area I feel at least nominally qualified to comment on. I will spare the usual policy indictments and accusations of malfeasance at the Fed and at the treasury; to arrive at a reasonable estimate of what the market is worth, just as sort of a reality check.
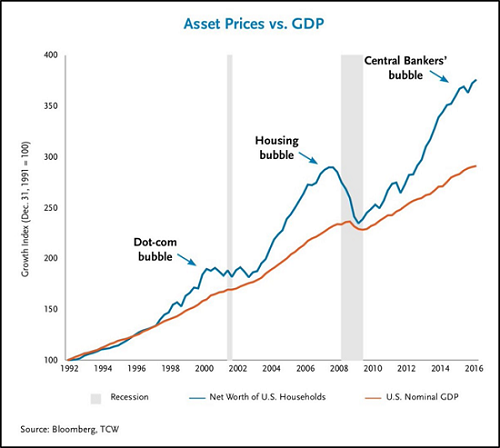
First, most of the known methods of calculating the objective worth of the market try to determine the relationship between Asset prices and Gross Domestic Product. Below is one such chart. Yes, it is possible to "game" a chart like this, but I wanted to get it out there just to get your attention. When the market is high relative to GDP, then it becomes harder to see where the growth is going to come from.
This next chart shows the relationship between Fed money printing and the stock market. The recent news is that the Fed is going to start retiring the bonds created with this money, so the balance sheet reduction will likely have a negative effect on the stock market.

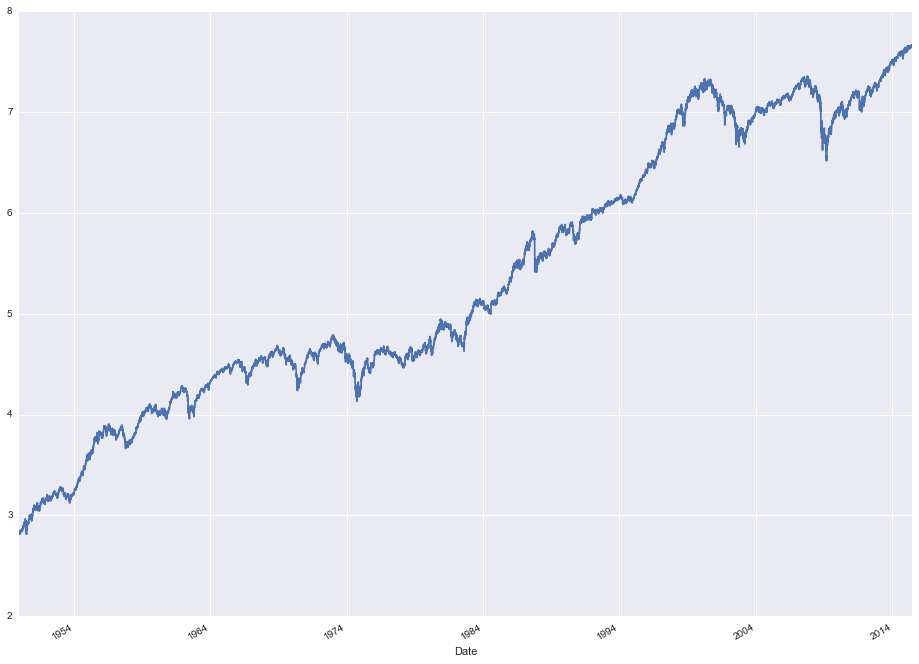
For exhibit "C", I'd like to point out the CAPE market indicator, which prices a stock based on ten years worth of earnings, Has now blown past 30. This means, among other things, that it will take over 30 years to return your money and that likely earnings going forward are at best in the 2 to 2-1/4% range. That is, unless you see the market decline to more normal ratios. Then you might see some growth....after losing 40% of your principal.

The thesis for continued upward trajectory of the S&P from here is that historic growth and productivity improvements will continue into the future. The trends that make that a troublesome expectation are:
1. Higher interest rates, stemming from the return of bonds to the market.
2. Higher interest rates, stemming from the FOMC target rate increases.
3. Reduction in spending by the unemployed, the retired, and the dislocated.
4. Earnings shortfalls in a growing number of industries.
5. Government spending shortfalls due to rising interest on the 20 Trillion debt.
In addition, the speculative jump in stock prices will reverse when it becomes apparent that the Trump repatriation of overseas funds, the tax reform, and the Obamacare spending reductions are not going to happen.
Want some more charts?
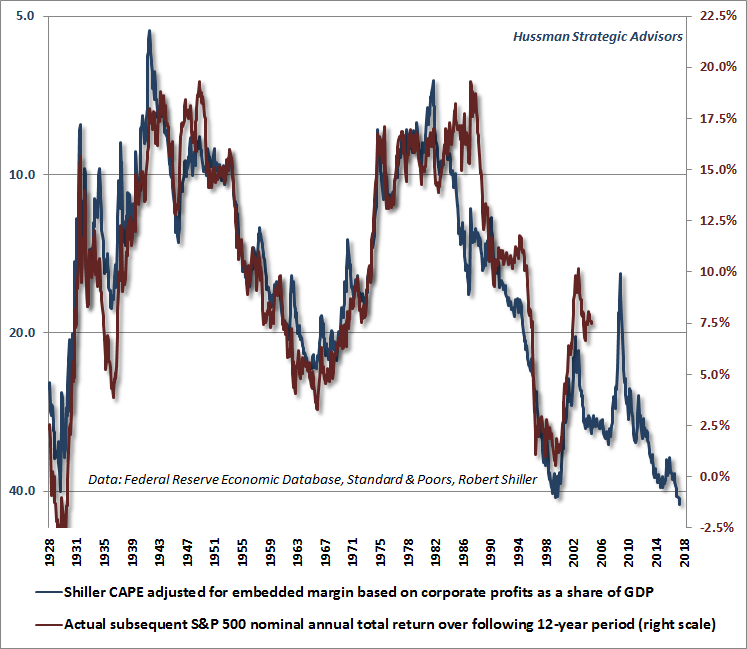
Here's one of my favorites. While there might be 2% to be had in the market today, there might not be 2% available over the next 12 years. Unless you're talking about -2%
Finally, every good bubble needs a pin to pop it. I nominate thois one:

For more info on that, look up the subprime auto loan market.
A great many indicators are flashing red today, and this is the high priced market even Warren Buffet wouldn't want to buy into. The risk of a serious drop in the S&P should be viewed as extremely likely.
I call that a bubble.
No comments:
Post a Comment